Analytics with Pandas
Pandas allows you to create a DataFrame that enables easier viewing and exploration of results, such as when you perform analytical operations like filtering.
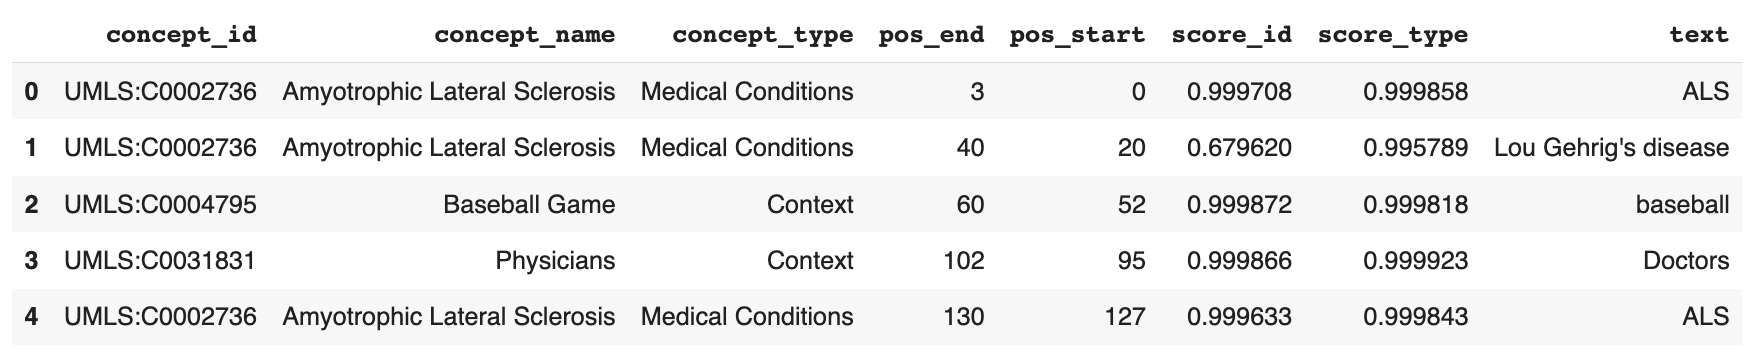
In this example, we’ll make a request to the API’s structure endpoint, pass the results directly to a pandas DataFrame, and display the results in a table using the pandas json_normalize operation.
# Import the ScienceIO library
from scienceio import ScienceIO

# Create a scio object
scio = ScienceIO()

# Submit the request
query_text = "ALS is often called Lou Gehrig's disease, after the baseball player who was diagnosed with it. Doctors usually do not know why ALS occurs."

response = scio.structure(query_text)

# Use pandas to display the results in a table
import pandas as pd
df = pd.json_normalize(response['spans'])
df
The results display like this:
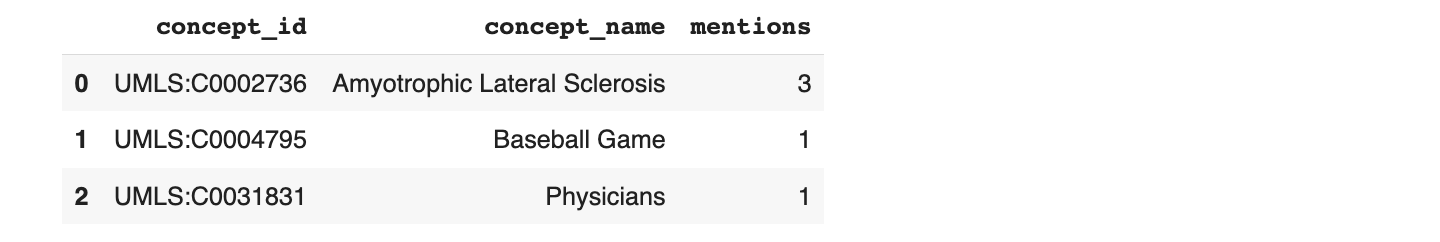
Now, you could perform further analysis by using pandas to get a count of how often each concept was mentioned. Do this with the pandas groupby operation, and aggregate by concept_id and concept_name:
# Aggregate by concept_id and concept_name
df.groupby(["concept_id", "concept_name"]).count()["pos_start"] \
            .reset_index() \
            .sort_values(by="pos_start", ascending=False) \
            .rename(columns={"pos_start": "mentions"}) \
            .reset_index(drop=True)
The results look like this:
Feedback
Was this page helpful?
Great! If you ever have questions or want to provide feedback, send us an email.
Bummer. We hate when we miss the mark. If you have suggestions for improvements or other general comments, send us an email.